
Upstack Attribution — Marketing Attribution & Analytics for DTC
Know what every channel is actually worth
Multi-touch attribution, blended performance and contribution margin in one view — reconciled against the revenue in your Shopify account rather than summed from platforms that each claim the same order.








Brands running on Attribution























Measurement OS
Measurement that changes what happens next.
Upstack closes the actionability gap between platform reports and store revenue, so every decision is grounded in the same buyers, orders, and margin.
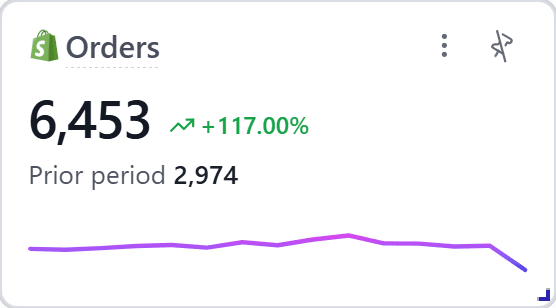
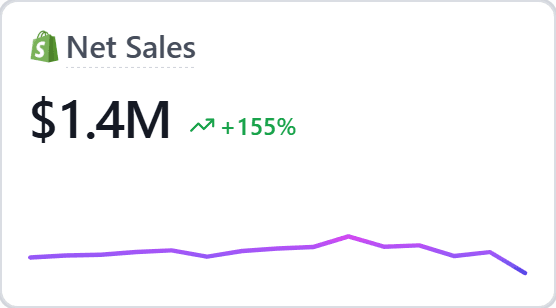
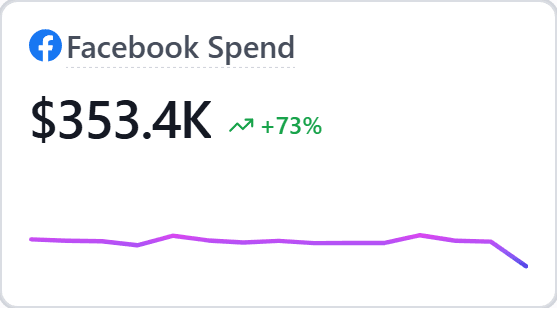
Profit & loss
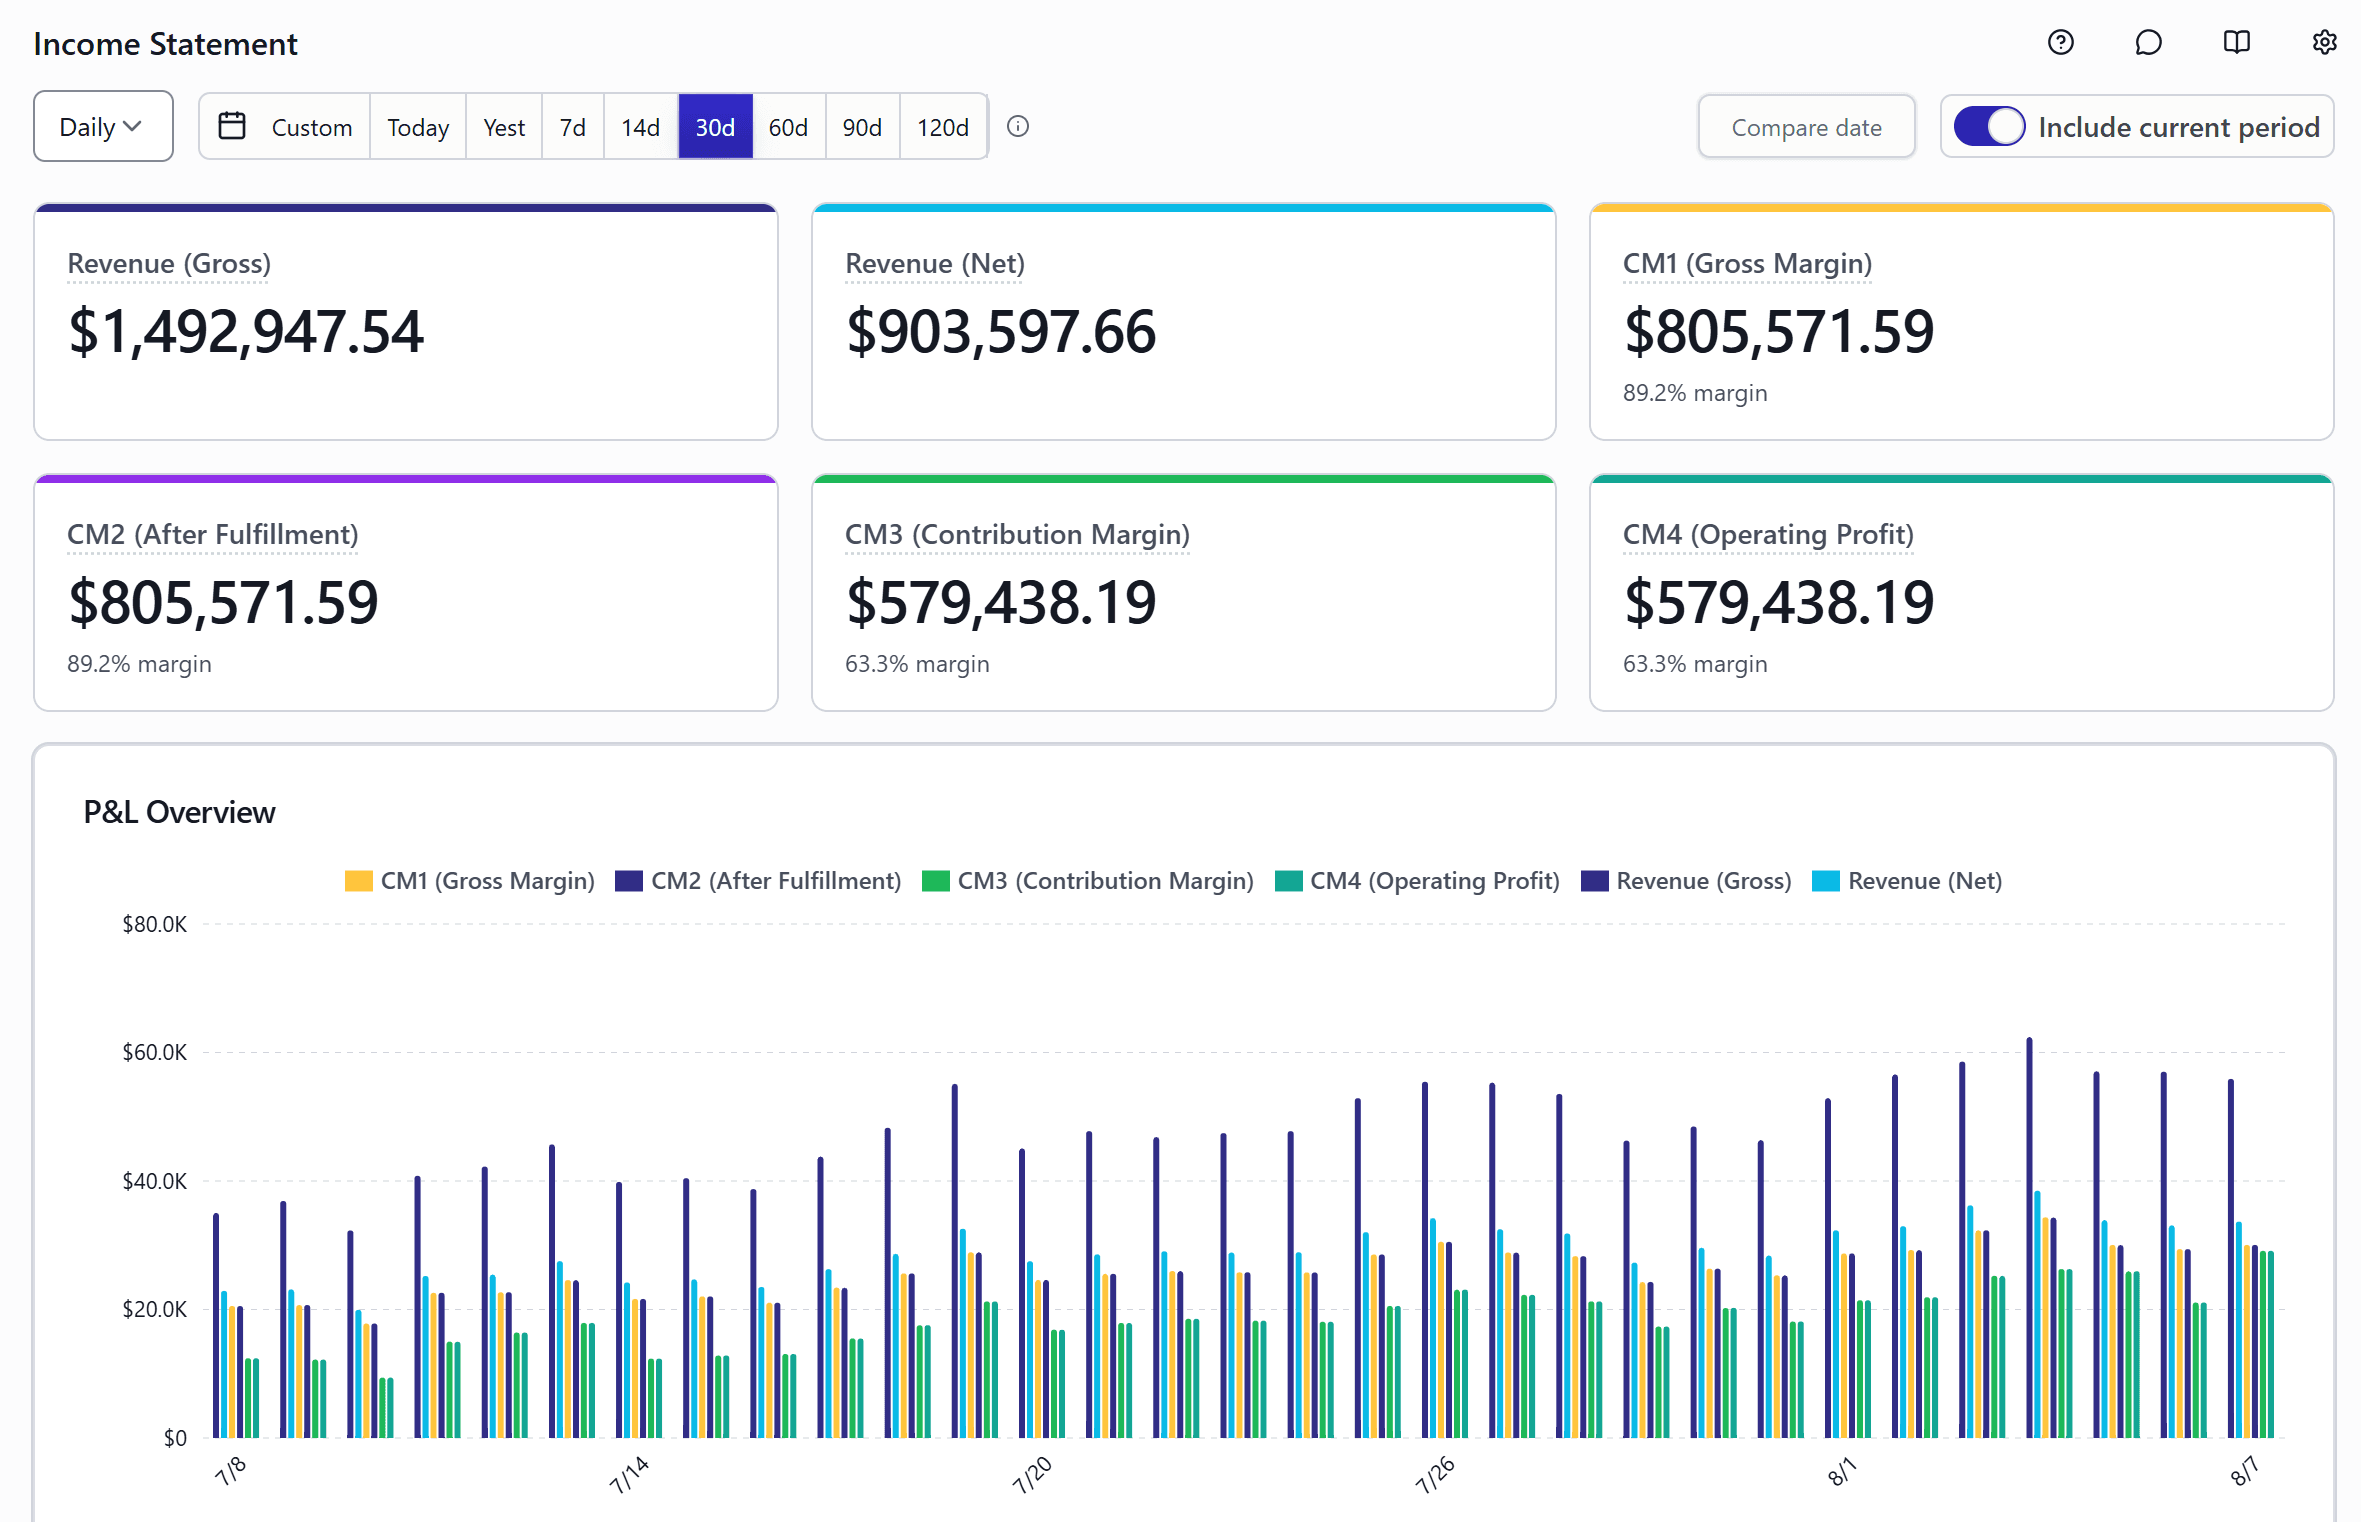
Gross revenue down to operating profit.
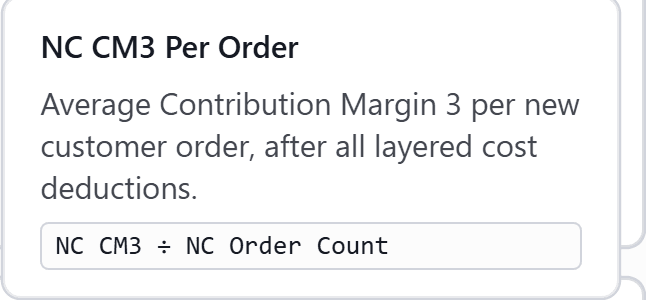
A campaign at 3× ROAS on a 22% margin product is losing money. The full ladder is reported — CM1 through CM4 — with costs pulled from the systems that already hold them, so margin is a number you read rather than a spreadsheet you rebuild every month.
See your own channels reconciled to store revenue.
Marketing analytics
The numbers you actually run the business on.
Attribution answers which channel earned the credit. These answer whether the spend was worth making — on one basis, across every channel, down to the creative.
New customer ROAS
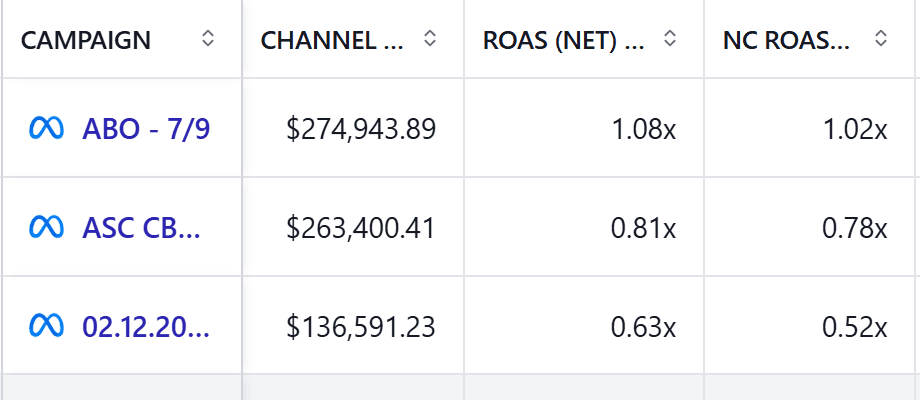
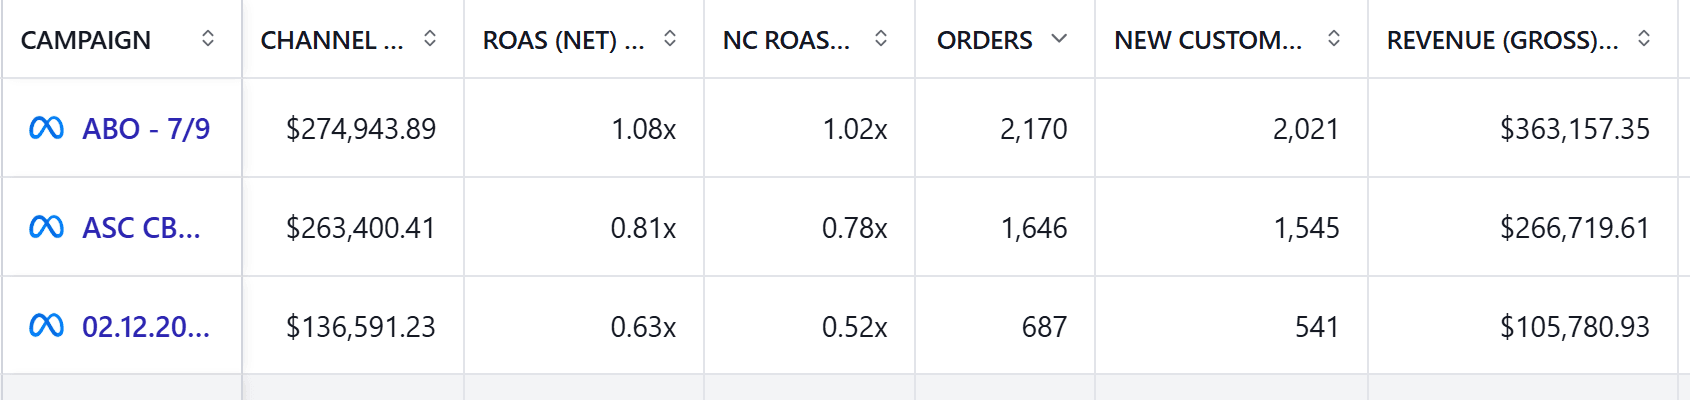
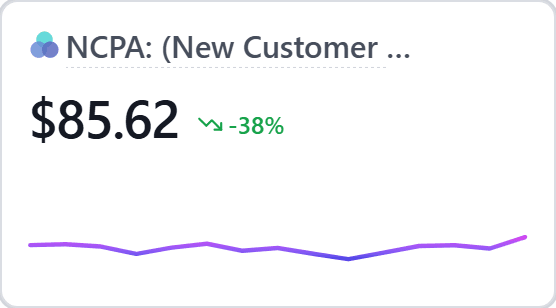
Return measured on the customers you did not already have. Returning-customer revenue stops flattering campaigns whose job was acquisition.
new customer ROAS · blended ROAS · MER
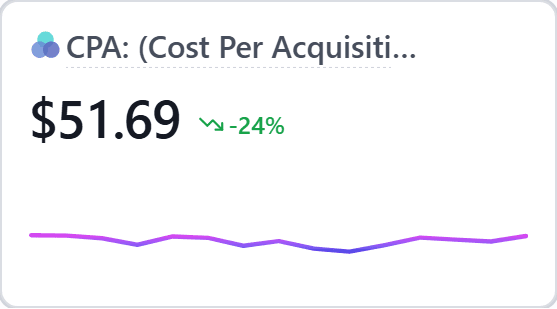
New customer CAC
What it costs to acquire someone new, separated from what it costs to re-acquire someone you already paid for once.
new customer CAC · blended CAC
Ad and product performance
Every ad you have run and every product you have sold, across the full history pulled from Shopify and each ad account — not just the retention window.
channel → campaign → ad → product
LTV, payback and cohorts
What each acquisition cohort is worth over time, new-customer LTV against new-customer CAC, and the day a cohort pays back what it cost.
LTV · new customer LTV · LTV:CAC · payback
Event quality
Match rates and event completeness reported alongside the performance numbers, so you can see the condition of the data the reports are built on.
match rate · event completeness
Custom measures and dashboards
Define the measure your business actually runs on, then build the view around it. Custom dashboards, saved views, no SQL.
custom measures · custom views
Results
What brands did once the numbers agreed.
90× ROI
Return on the platform fee, and $92K a month in recovered abandonment revenue.
See every channel reconciled against your Shopify revenue.
Integrations
Reads from the stack you already run.
61 integrations across ecommerce, ad platforms, email and your warehouse — 17 sources in, 44 destinations out.





Common questions
Attribution and analytics, answered.
How is this different from the reporting in my ad accounts?
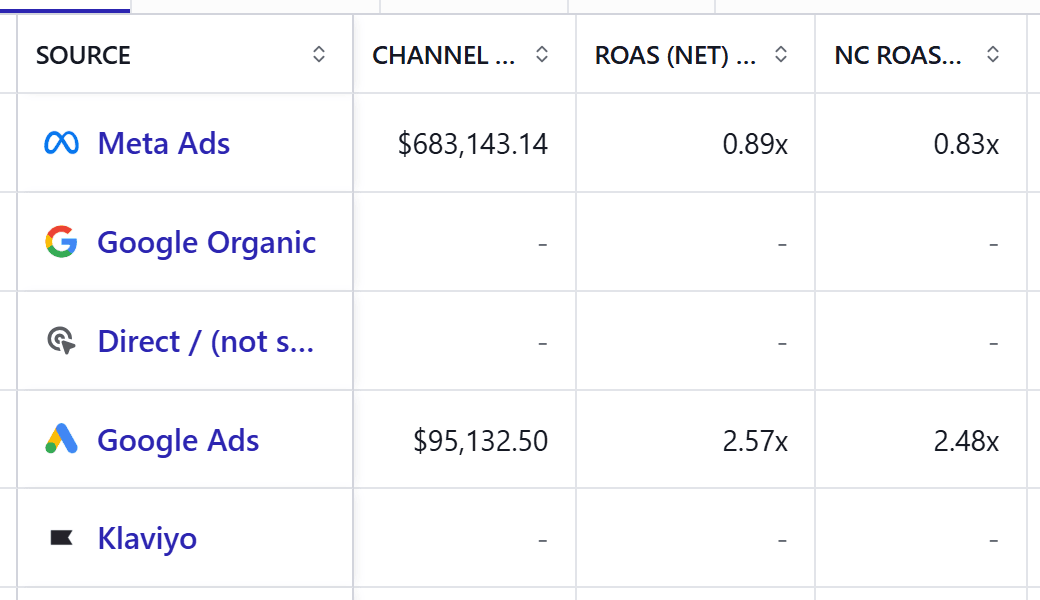
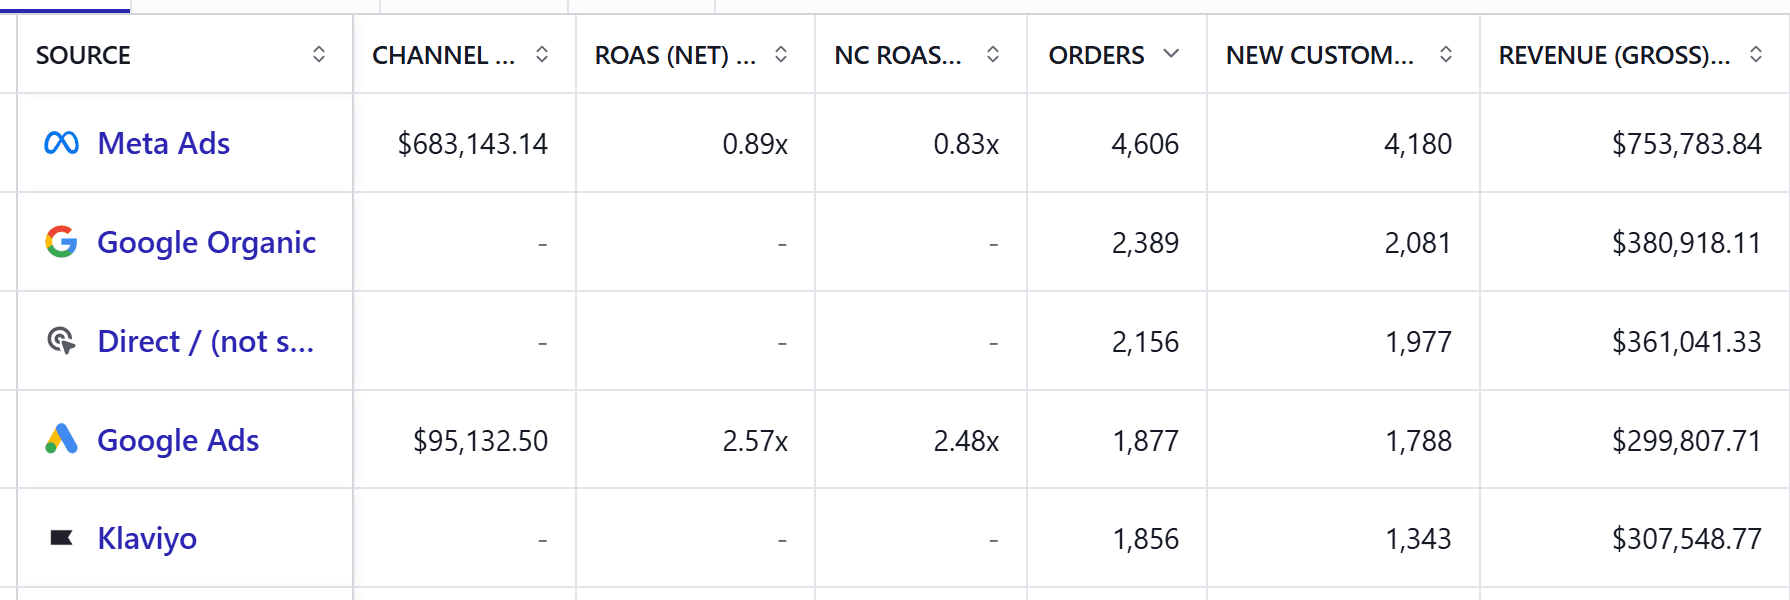
Ad platforms report on the conversions they can see and claim, which is why four platforms can each take credit for the same order. Attribution reconciles every channel against Shopify revenue on one basis, so the totals add up to what actually happened.
Which attribution model should I use?
There isn’t one right answer, which is why all four — first click, last click, any click and data-driven — run at once rather than being a setting you commit to. Compare the same campaign across them and look at where they disagree; that disagreement is usually where the interesting spend is.
Do I need a data warehouse?
No. Attribution works on its own. If you already run a warehouse you can send the same resolved events there and reconcile against it.
How far back does history go?
There is no retention limit. Upstack pulls your full history from Shopify and from every connected ad account, so year-over-year, seasonal and long-cohort comparisons stay available instead of rolling off a window.
Can I see it hour by hour?
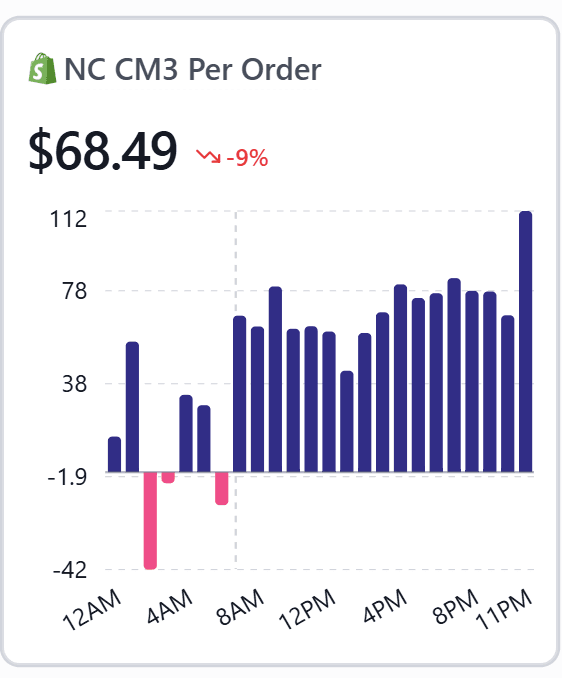
Yes — granularity runs from hourly through daily, weekly and monthly to yearly, on the same underlying numbers.
Where do my costs come from?
COGS is pulled from Shopify automatically. Shipping, fulfilment, duties, taxes, payment fees and operating expenses are configured once in the cost centre and subtracted from then on.
Does this replace Signal, or run alongside it?
Alongside. Signal fixes what reaches the ad platforms; Attribution reports on it. They read from the same resolved events, so the reports and the platforms are finally looking at the same customer.
Can I see channels other than Meta?
Yes — every connected ad platform, plus email and SMS, on the same basis and in the same view.
The rest of the stack
Attribution reports on it. Signal and Audience act on it.
See what your channels are really worth.
Connect your store and ad accounts, and compare your own numbers across every model before you change a budget.